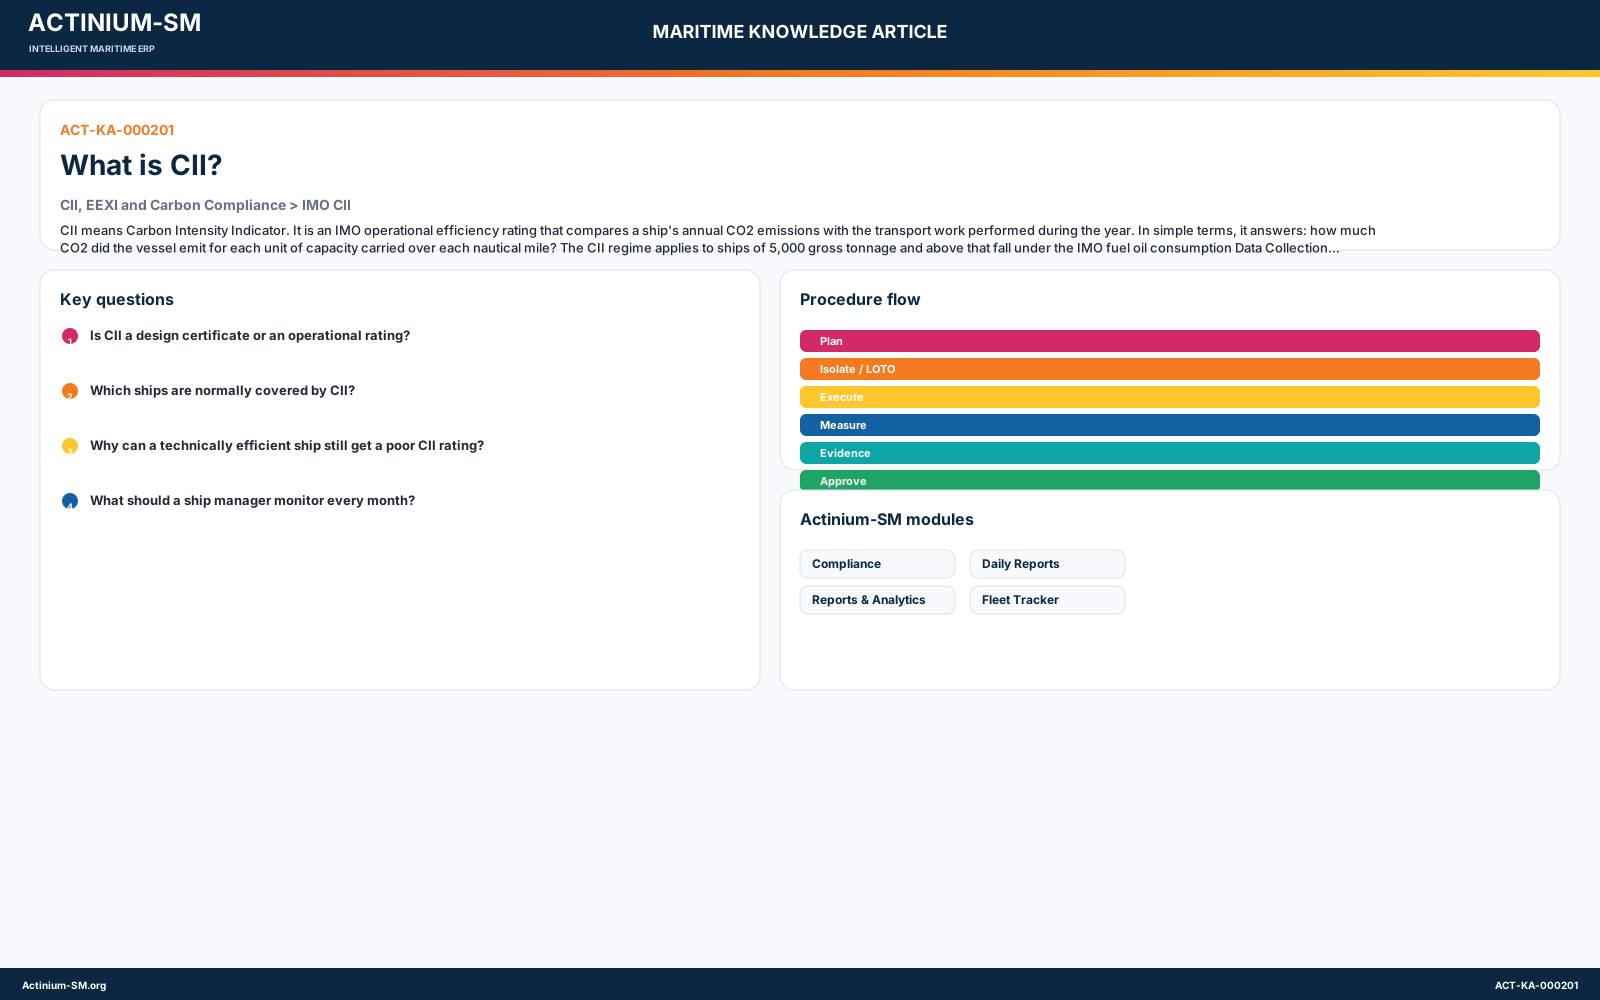
CII means Carbon Intensity Indicator. It is an IMO operational efficiency rating that compares a ship's annual CO2 emissions with the transport work performed during the year. In simple terms, it answers: how much CO2 did the vessel emit for each unit of capacity carried over each nautical mile?
The CII regime applies to ships of 5,000 gross tonnage and above that fall under the IMO fuel oil consumption Data Collection System. Each year, the vessel receives an A, B, C, D or E rating. A is the best rating and E is the worst rating. A vessel rated D for three consecutive years, or E for one year, needs a corrective action plan in SEEMP Part III.
Difficulty: BeginnerReviewed: 2026-07-24
Carbon Intensity IndicatorCII shippingIMO CIICII ratingSEEMP Part III
Knowledge graphic · ACT-KA-000201
Frequently Asked Questions
Is CII a design certificate or an operational rating?
CII is an operational rating. It is mainly affected by annual fuel consumption, CO2 factor, distance sailed, cargo capacity basis, idle time, speed profile, hull condition, weather, routeing and reporting quality.
Which ships are normally covered by CII?
IMO CII is linked to ships of 5,000 GT and above that report fuel oil consumption under IMO DCS. Applicability and metric basis depend on ship type, so the vessel's SEEMP and flag/class guidance should be checked.
Why can a technically efficient ship still get a poor CII rating?
Because CII measures operational performance over the year. Long waiting periods, ballast voyages, low cargo utilization, high speed, poor hull condition or bad weather routing can pull down the rating even if the ship design is efficient.
What should a ship manager monitor every month?
Monitor attained CII, required CII, rating forecast, CO2 by fuel type, distance, transport work, idle/anchorage fuel, weather impact, hull/propeller condition, speed profile and data completeness.
Technical Explanation
CII is calculated after the reporting year using verified annual data. The most common form for cargo ships is based on the annual efficiency ratio:
Attained CII = annual CO2 emissions / annual transport work
Annual transport work is normally capacity multiplied by distance travelled. For many cargo ships, deadweight is used as capacity. Some ship types use gross tonnage based metrics.
The attained CII is compared with the required annual CII for that vessel type and size. The required value is derived from IMO reference lines and annual reduction factors. The result is then converted into an A to E rating band.
Applicable IMO / Class / Flag Requirements
• MARPOL Annex VI, Chapter 4
• IMO short-term GHG measures for EEXI, CII and enhanced SEEMP
• IMO CII calculation guidelines, reference line guidelines, reduction factor guidelines and rating guidelines
• Ship Energy Efficiency Management Plan, Part III
• IMO DCS annual fuel oil consumption reporting
Step-by-Step Procedures
1. Confirm whether the vessel is within CII scope.
2. Verify vessel type, capacity basis, reference line and applicable reduction factor.
3. Collect annual fuel consumption, fuel type and distance sailed from submitted noon reports and bunker records.
4. Convert fuel consumption to CO2 using accepted conversion factors.
5. Calculate attained CII and compare it with required CII.
6. Assign A, B, C, D or E rating.
7. If rating risk is D or E, prepare and track SEEMP Part III corrective actions.
Checklists
• Vessel type and capacity basis confirmed
• IMO number and reporting year confirmed
• Annual fuel consumption reconciled with bunker ROB
• Distance travelled checked against noon reports
• Excluded or adjusted voyages reviewed only where permitted
• Required CII and rating band stored
• Corrective action plan prepared for D/E risk
Practical Case Studies
A tanker consumes fuel that produces 24,000 tonnes of CO2 during the year. If its annual transport work is 8,000,000 deadweight-tonne nautical miles, its attained CII is 3.0 gCO2/dwt-nm. The rating then depends on the vessel's ship-type reference line, reporting year reduction factor and IMO rating boundaries.
KPI Monitoring
• Monthly attained CII against required CII
• Forecast annual rating
• CO2 per nautical mile
• Fuel consumption at sea versus waiting/port time
• Data completeness and correction log
• Corrective actions closed versus planned
• CII workflow diagram: fuel consumption -> CO2 -> transport work -> attained CII -> rating band -> SEEMP action.
References
• IMO EEXI and CII FAQ: overview of mandatory measures, A-E ratings and corrective action plan trigger.
• IMO improving energy efficiency of ships: SEEMP, IMO DCS, EEXI and CII overview.
• IMO GreenVoyage2050 CII video series: CII framework, DCS, SEEMP and verification topics.
Track CII continuously in Actinium-SM instead of waiting until year-end.
Turn encyclopedia knowledge into executed jobs, evidence, and audit-ready records.